Have you ever felt overwhelmed by the sheer volume of sales data you’re handling, unsure of which metrics really matter? You’re not alone. McKinsey’s research has shed light on this common challenge: too much data without a clear focus leaves sales leaders struggling to uncover those “aha” moments that drive confident decisions and long-term growth.
Good news! There’s a clear way forward. To make the most of your tools, teams, and customer connections, hone in on B2B sales key performance indicators (KPIs) that maximize your efforts while ensuring steady revenue. This involves a blend of well-known benchmarks, such as lead conversion rate, and metrics that assess long-term value, like customer and employee retention.
Below, we’ve got everything you need to know about B2B sales KPIs that pave the way for a healthy, productive, and growing business.
Decoding B2B Sales KPIs
In sales, KPIs refer to the metrics utilized to gauge the alignment of a sales team’s performance with predetermined objectives and its overall impact on the business. These metrics encompass figures such as the average number of leads generated per quarter and the rate of deal conversion.
Why B2B Sales KPIs Matter
B2B Sales KPIs serve as the common language for all team members and leaders, ensuring everyone is on the same page regarding the crucial metrics driving company growth. Instead of each person focusing on their own metrics, KPIs align efforts towards key measures impacting the business. While they aren’t sales targets per se, they are powerful indicators of activities driving success. Sales leaders set target KPIs to guide teams towards revenue goals, ensuring unified efforts towards shared objectives.
Understanding Sales Metrics vs. Sales KPIs
Your sales KPIs are intimately tied to your sales and business objectives. For instance, if the overarching goal is to achieve 1,200 sales in a year, a corresponding KPI might be reaching 100 sales each month. (100 sales per month x 12 months = 1,200 sales)
Sales metrics, on the other hand, encompass any measurable aspect of sales performance. This could include the number of tasks completed by sales reps, the quantity of leads in the sales pipeline, or any other sales-related metric. The crucial distinction is that sales metrics don’t necessarily need to directly align with these broader objectives.
The Essential B2B Sales KPIs You Can't Ignore
When it comes to B2B sales, certain metrics have always taken the spotlight: new leads, quarterly closed deals, and individual quotas. While these are still crucial, they often rely on sporadic, one-time transactions. To truly ensure your company’s success in the long run, you need to keep tabs on both the foundational sales KPIs and those that gauge the lasting value of customer and employee relationships.
Let’s explore the key sales KPIs you need to know:
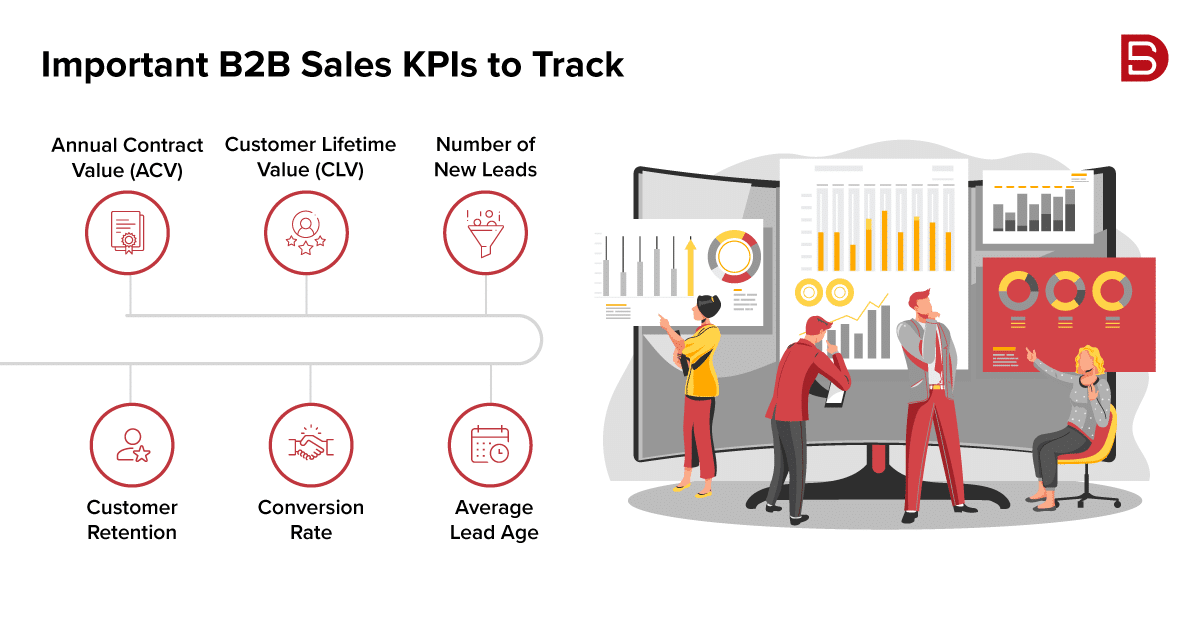
1. Annual Contract Value (ACV)
It is simply about understanding how much, on average, a customer spends on a contract in a year. It’s important because it helps sales teams see where they can potentially increase contract values, either through upselling or cross-selling. And if those options aren’t available, a low ACV might suggest that it’s time to focus on bringing in new customers to boost revenue.
To calculate: Divide the total sales value of contracts for the year by the number of contracts.
2. Customer Lifetime Value (CLV)
It is the total value of all purchases a customer makes, including upsells, cross-sells, and renewals, throughout their relationship with your company. It’s crucial because it shows how well your team is nurturing long-lasting, trust-based customer relationships that lead to additional sales and predictable revenue. If your CLV is lower than expected, you can analyze call transcripts from your top customers to understand what strategies work best, then replicate them in future deals.
To calculate: Multiply the average purchase value per year by the average number of purchases per year for each customer, and then multiply that by the average customer lifespan in years.
3. Number of New Leads
This metric tracks the number of fresh leads added to each sales representative’s pipeline within a single quarter. It’s ital because it helps gauge whether reps are consistently bringing in enough potential customers to meet sales targets. If the number of leads falls below the target KPI, it may indicate a need to focus more on prospecting efforts. A common strategy to engage with more prospects is to increase activity on LinkedIn. By following potential prospects, engaging with their posts, and sending connection requests, reps can expand their network and attract more leads.
4. Average Lead Age
This metric tracks how long leads linger in the pipeline without converting into closed deals, typically assessed per sales representative. It’s essential because while a full pipeline is positive, stagnant leads consume valuable time that could be directed towards advancing more promising opportunities. If a rep consistently has stale leads, it might be time to review their pipeline and eliminate leads unlikely to progress.
To calculate: Divide the total age of all active leads per rep by the number of active leads.
5. Conversion Rate
Also known as win rate, indicates the percentage of a sales rep’s leas that successfully convert into closed deals, typically monitored on a quarterly basis per rep. This metric is crucial because it highlights the effectiveness of a rep’s sales strategies or processes. If a rep consistently surpasses the target conversion rate, their techniques can be scaled across the entire sales team. Conversely, lower conversion rates may signal the need to refine or simplify sales tactics to boost conversions. Leveraging call recording and analysis tools, along with regular one-on-one coaching sessions, can provide valuable insights for improvement.
To calculate: Divide the number of deals closed during a quarter by the number of leads in the pipeline, then multiply by 100.
6. Customer Retention
Customer retention measures how many customers stick with your products or services, while churn rate shows how many decide to leave. Here’s why it matters: while new customers boost revenue, they also demand significant resources to acquire. By focusing on customer retention and seizing upsell and cross-sell opportunities, you’re ensuring steady revenue and maximizing ROI. If you spot a drop in customer retention, it’s time to review your team’s engagement strategies and prioritize existing customer relationships.
To calculate: Subtract net new customers acquired during the year from the total customers at year-end, then divide by the number of customers at the start of the year, and multiply by 100.
Navigating Sales KPIs Tracking
You can monitor sales KPIs through a CRM system, which utilizes customer and sales performance data to assess progress towards these goals. Most CRMs provide visualization tools or customizable dashboards to aid in interpretation. These dashboards offer a comprehensive view of sales and company performance, enabling sales reps and leaders to make informed decisions that drive revenue growth.
Conclusion
While there’s a plethora of sales KPIs to monitor, honing in on the right ones hinges on your current business priorities. Start by pinpointing your overarching goals. Are you striving for rapid growth, or aiming to maximize revenue with your existing resources and investments?
Once you’ve aligned on these larger goals, you can handpick the sales KPIs that best match your objectives. By targeting these metrics, you’ll ensure you’re on track to achieve your broader business goals. Tired of chasing after low-quality leads? Say goodbye to wasted time and effort! At Datamatics, we specialize in delivering high-quality leads that drive real results. Reach out to marketing@datamaticsbpm.com and let’s elevate your lead generation game together!
 Select an element to maximize. Press ESC to cancel.
Paul van de Kamp